Data-driven customer segmentation uses machine learning to group customers by shared attributes across many dimensions at once. Cluster analysis is a common approach because it can combine demographics, behavior, purchase history, and engagement signals to uncover patterns that manual segmentation rules can miss. Sources describe algorithms such as k-means, hierarchical clustering, and DBSCAN, each suited to different situations. The goal is to maximize similarity within each group and differences between groups, so each segment becomes actionable for personalization, churn prediction, and budget allocation across customer value tiers.
For customer segmentation analytics in Malaysia, the workflow starts with data readiness. One guide recommends preparing data so the model has enough signal: at least 500 records per expected segment, less than 30% missing values, and feature scaling to prevent high-magnitude variables from dominating distance calculations. Malaysian e-commerce research cited in the sources describes a dataset of 285 million customer purchase histories from Malaysian e-commerce, and it highlights that demographic, psychographic, behavioral, and geographic factors matter for effective segmentation. The same source states that k-means clustering, particularly SAPK + K-Means, improves segmentation accuracy and reduces error rates.
Choosing and Validating Clusters Before You Activate Them
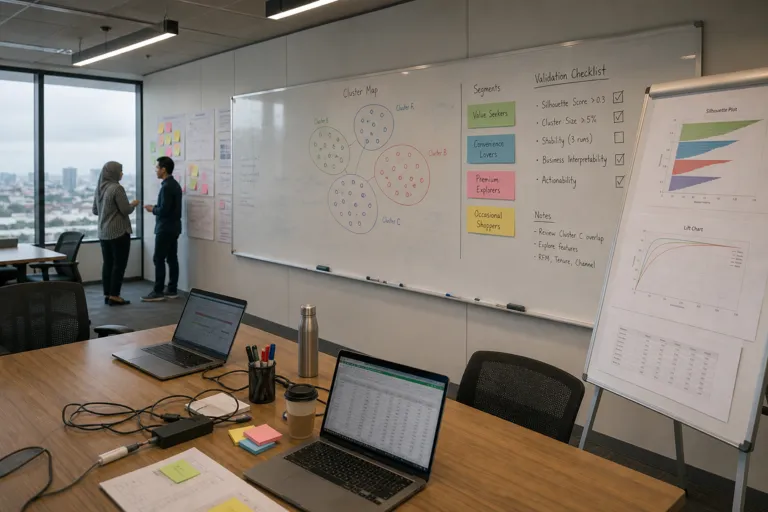
Algorithm choice should match your business context. K-means is described as the most common method, but it requires you to predefine the number of clusters. If you do not know K, sources note that hierarchical clustering can help, while DBSCAN can handle arbitrary shapes and outliers. Validation is critical to avoid “false patterns.” Recommended checks include the elbow method with within-cluster sum of squares (WCSS), silhouette coefficients, and the Davies-Bouldin index, plus stability testing on holdout samples. One guide states that a silhouette score above 0.5 indicates good separation, providing a clear quality threshold to review before using segments in campaigns.
Several examples in the sources show how cluster counts and segment definitions can differ by dataset. One research paper states an optimal cluster count of five, with each group showing unique behavioral and financial characteristics, and it reports that k-means-based segmentation supports personalized marketing and profit improvement. Another tutorial-style project identified eight distinct customer segments in a credit card context, using customer behavior and demographic data to interpret opportunities for targeting. The takeaway for Malaysia is not that one number is “right,” but that teams should test multiple K values, validate the separation and stability, and only then interpret each cluster as a real segment with a clear business story.
Activation is where clustering becomes revenue-relevant. Sources recommend mapping clusters to CRM tags, ad platform audiences, email cadences, and channel strategies, so each segment receives different messaging, offers, and service treatments. They also stress ongoing refresh cycles because customer preferences change, making segmentation more agile when updated with the latest data. In practice, this means defining a repeatable pipeline: prepare and scale features, test k-means versus alternatives, validate with silhouette and other metrics, and then operationalize segments in marketing systems. Done well, cluster analysis supports a more objective, data-driven segmentation approach than rule-based methods when attributes multiply and interactions become non-obvious.
What is cluster analysis in customer segmentation?
What data quality checks matter before clustering customer data?
How do teams validate whether clusters are actually meaningful?
How can customer segmentation analytics in Malaysia use local e-commerce data?
What happens after segments are created with clustering?