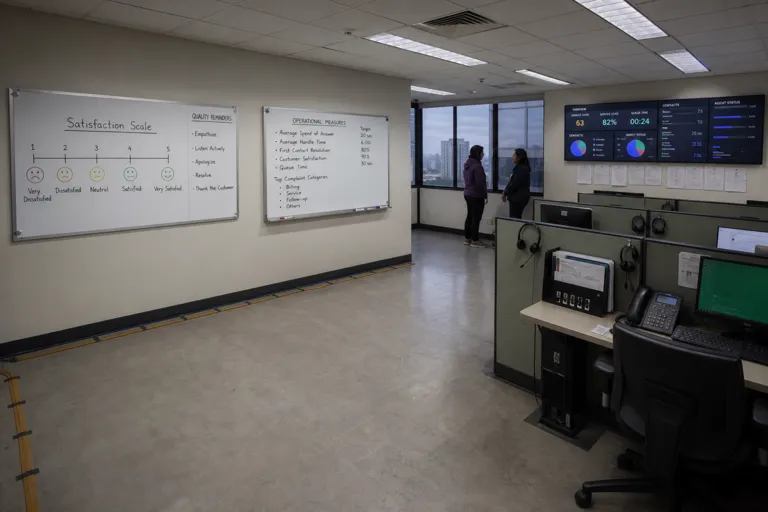
Many teams run a customer satisfaction survey in the Philippines and get strong top-box scores. Yet high ratings can still coexist with real inconvenience. A Qualtrics-reported result illustrates how upbeat customer feedback can look: 72% of consumers in the Philippines said they were satisfied with their brand interactions, compared with 66% globally. It also breaks out categories with very high satisfaction, including fast-food restaurants (85%), grocery stores (82%), and streaming services (81%). When positivity is common, the risk is not that the ratings are “wrong,” but that they are too blunt to show which moments create avoidable dissatisfaction.
One practical way to correct for positivity bias is to anchor satisfaction to concrete events and compare subgroups. In the JD Power 2019 Philippines Customer Service Index (CSI) Study for vehicle owners, overall satisfaction decreased to 803 (on a 1,000-point scale) in 2019 from 812 in 2018. The same study points to specific service-center frictions that shift sentiment. More than one-third of customers (35%) experienced wait times of more than 30 minutes to hand over their vehicle, and satisfaction among those customers was lower than among customers with shorter handover times (787 vs. 820). These kinds of operational cuts help survey teams interpret positive averages without ignoring pain points.
How to Design Philippine Surveys That Reveal Hidden Friction
Survey design can also use “behavioral splits” to reveal masked dissatisfaction. JD Power found that nearly three-fourths (73%) of customers scheduled an appointment for vehicle service, which was 10 percentage points lower than in 2018, and satisfaction was higher when customers made an appointment versus when they did not (807 vs. 795). It also reports that only 39% of customers were offered an express service, a drop of 16 percentage points from 2018; among customers who made appointments, satisfaction was 23 points higher when express service was offered than when it wasn’t (820 vs. 797). Instead of only asking for an overall score, a Philippine survey can ask whether these steps happened, then analyze satisfaction gaps by experience path.
Another bias correction is to pair numeric ratings with drivers and relationship indicators. A JBMS study of 338 online shoppers in Santiago City used descriptive and correlational analyses and reported that perceived reputation of the retailer has a strong positive correlation with customer satisfaction (r = 0.681, p < 0.001). It also noted a strong positive correlation between consumer lifestyles and perceived benefits from online shopping (r = 0.608, p < 0.001), and stated that brand image or word-of-mouth is the leading indicator of customer loyalty within the Philippine market. In practice, this means teams should treat satisfaction scores as one layer, and add driver questions on reputation, perceived benefits, and advocacy signals to detect “polite” ratings that do not predict loyalty.
Finally, open-text feedback and external listening can counterbalance overly positive scales. One study working with unstructured survey responses described a dataset of 56,000 Filipino and English-word responses that were manually annotated and split into training and testing datasets. Related work in the same document discusses collecting 1,000 tweets for each ISP to estimate satisfaction with service quality, using text analytics and sentiment analysis. For teams building a customer satisfaction survey Philippines program, this suggests a hybrid approach: keep the rating for trend tracking, but always collect a brief “why” comment and periodically validate themes with text signals from channels like social media. Separately, broader consumer panels can strengthen representativeness; for example, Standard Insights reported surveying 681 individuals across the Philippines in January 2025, with red herrings, traps, and consistency checks to support data quality.
How can a customer satisfaction survey in the Philippines avoid overly positive scores?
What Philippine benchmarks show satisfaction can shift when friction appears?
What does research say are strong drivers of satisfaction for Filipino online shoppers?
How can text analytics help validate satisfaction ratings in the Philippines?