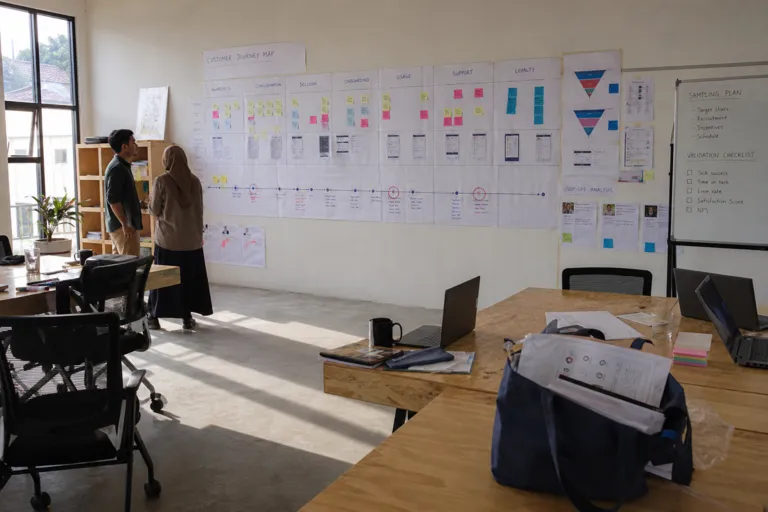
Teams often know where customers disappear. Analytics can show a drop at checkout or onboarding, and quantitative CX metrics can surface patterns such as drop-off rates, session durations, conversion rates, or NPS-style scores. But those numbers do not explain what the customer felt, which detail caused uncertainty, or which competitor they explored before returning later. That gap between the “what” and the “why” is the real reason to treat customer journey mapping as a research discipline. Customer journey mapping research systematically gathers data about how customers think, feel, and behave across stages from first awareness to post-purchase loyalty, then translates it into a visual map of stages, touchpoints, emotions, pain points, and motivations.
In practice, stronger maps are built in phases. One approach is to separate exploratory research (to understand the landscape, stages, and emotional drivers) from validation research (to confirm the draft map reflects what customers actually experience). This sequencing matters because assumption-based maps tend to mirror internal process rather than real behavior. Customers skip steps, jump channels, and struggle with things teams assume are obvious. A research-based version is harder to dismiss and easier to act on because it is grounded in interviews, observation, analytics, and behavioral data. A good starting point is auditing what you already have, including support tickets and complaint logs, NPS/CSAT/CES results, website and product analytics, sales call notes and CRM records, social feedback and reviews, and prior research reports, then sorting those signals by journey stage to reveal evidence gaps.
How to Combine Qual and Quant to Pinpoint Drop-offs
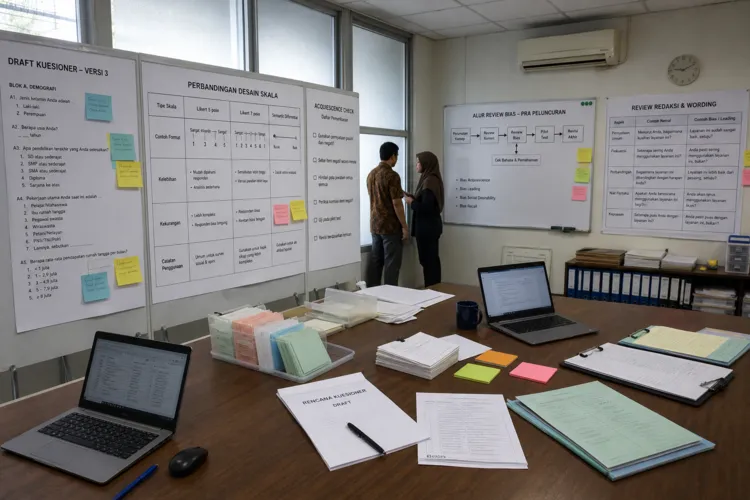
To find real drop-off points, combine the breadth of quantitative evidence with the depth of qualitative explanation. Quantitative analysis helps you identify where problems exist, while qualitative methods explain why they happen and what they mean to customers. For customer journey mapping research in Indonesia, that combined design can start by using analytics to locate the steepest stage-to-stage falloff, then layering in qualitative work to capture friction in customers’ own words. Interviews are a core method because they let you probe emotions and decision logic in real time. One practical guideline is that 8–15 participants per persona segment can provide strong thematic saturation in in-depth interviews, supporting faster learning without pretending the results are purely statistical.
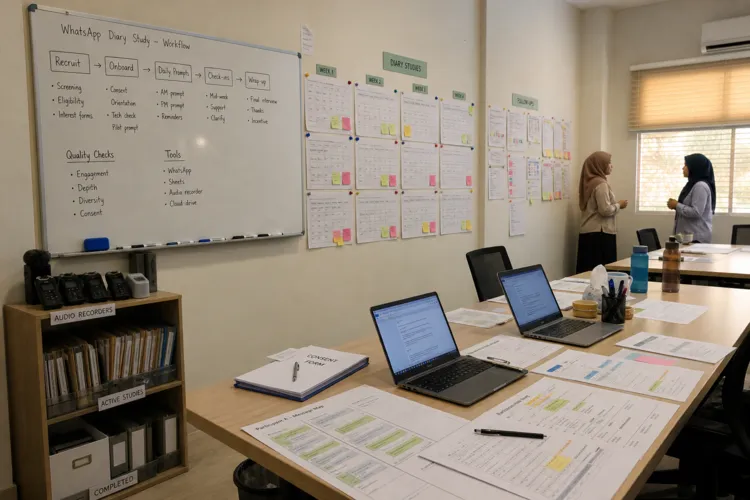
Then validate what customers say against what they actually do. Contextual inquiry and field observation can reveal the gap between stated and real behavior—such as when customers claim they checked an FAQ before contacting support, but observation shows they called immediately after hitting a confusing step. For longer, multi-touchpoint journeys, diary-style approaches can help capture experience over time rather than relying on memory alone. Additional qualitative tools, such as ethnographic or observational research (including digital ethnography), mobile diary studies, and qualitative UX/usability testing, can expose friction during key stages like consideration and purchase. Once these themes are documented, surveys can be used to validate which friction points are most widespread, and triangulation across surveys, interviews, and workshops improves reliability and usefulness.
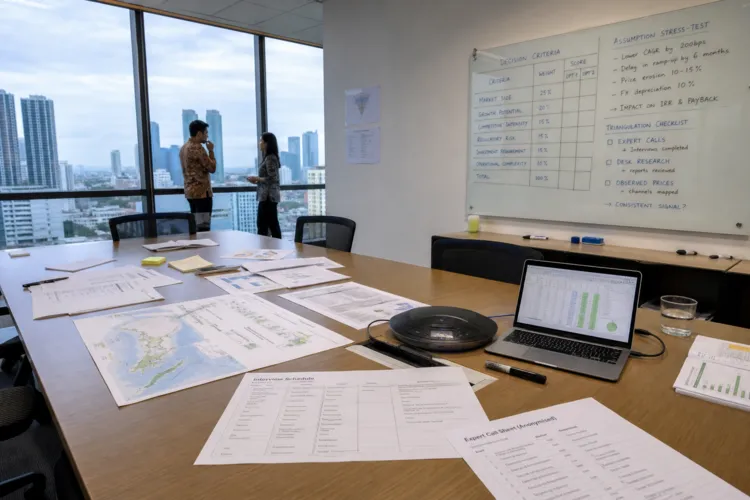
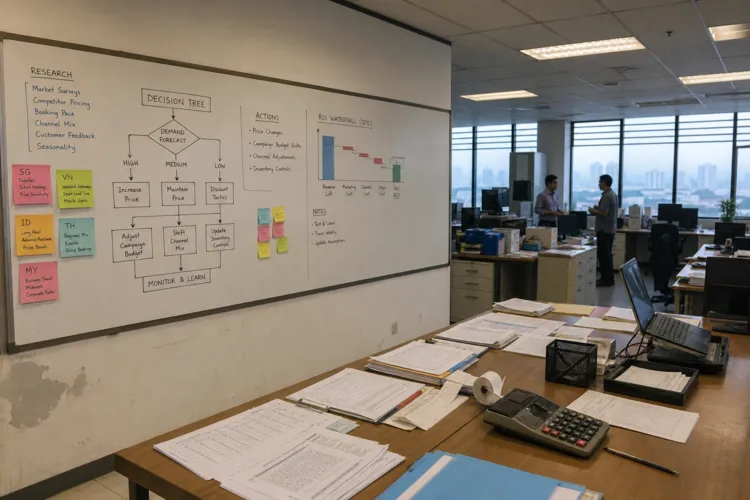
Finally, link the journey map to decisions. When stages align with real behavior, the journey becomes more quantifiable: stages describe where the customer is, and touchpoints describe how they move forward. If analysis shows a major drop during onboarding, improving that stage first allows incrementality tests to measure the impact of a stronger experience rather than a flawed one. Journey analysis can also integrate multiple signals—including qualitative insight from surveys or support feedback—to understand not only the paths customers take, but the economics behind each step. In fragmented, cross-channel environments, this evidence-led approach helps teams move beyond click-path debates and focus on the touchpoints that create hesitation, confusion, and abandonment.
What is customer journey mapping research, and what does it capture?
Why isn’t quantitative data alone enough to find true drop-off causes?
How many interviews are recommended per persona segment for journey mapping?
What sources should a team audit before starting new journey research?
How do you approach customer journey mapping research in Indonesia to find real drop-off points?