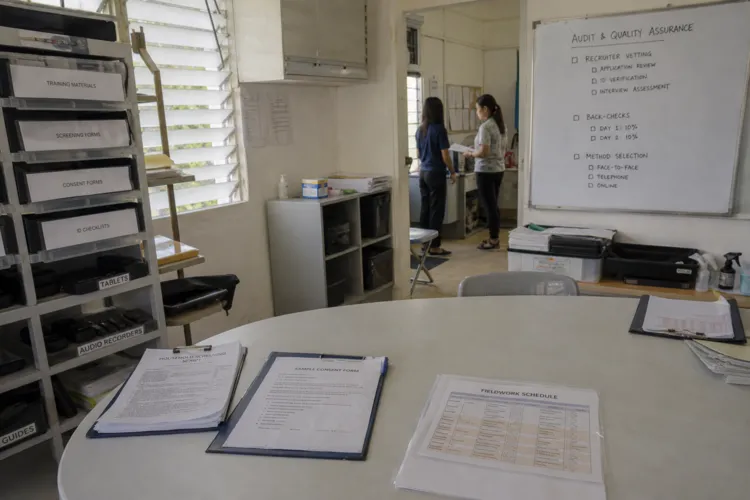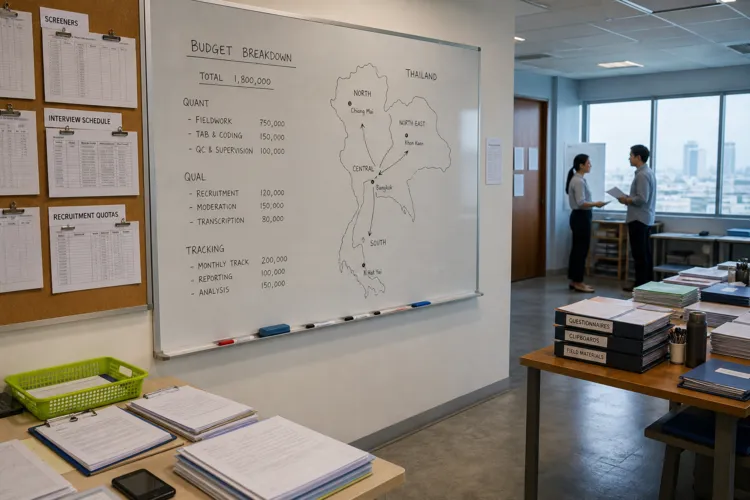
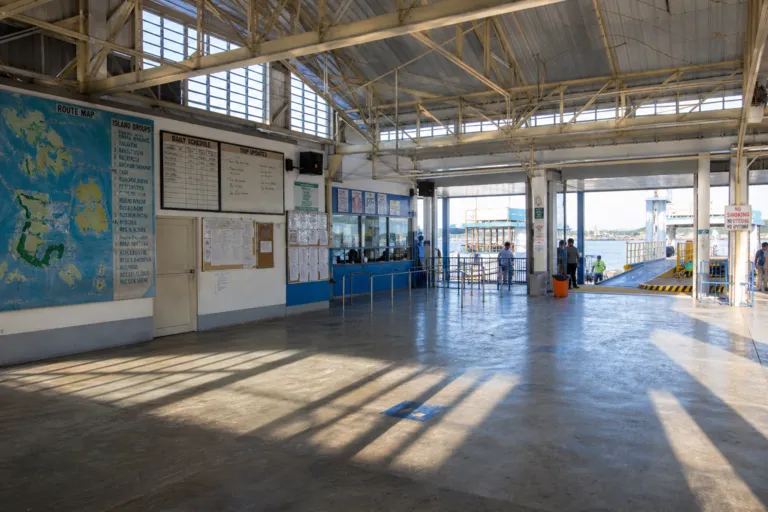
Getting a representative sample in the Philippines is not only a statistics problem. It is a geography and access problem. The country is an archipelago of 7,600 islands grouped into three major island groups: Luzon, Visayas, and Mindanao. Consumer behavior and channel preference can differ across Metro Manila, provincial Luzon, the Visayas, and Mindanao. That is why survey designs that treat the market as a single, uniform population risk reading one place as “the Philippines.” A practical plan starts with explicit coverage decisions, then matches fieldwork modes to where target respondents actually live and respond.
Geographic balance is the first lever. Iconic Research states that a nationally representative sample requires explicit geographic stratification across Luzon, Visayas, and Mindanao. It also warns that online panels skew toward Metro Manila and urban Luzon, which can inflate Metro Manila demographics at national scale. Context helps explain the pull of urban sampling. One source cites a population of 115.8M with 55% urban (World Bank, 2024), while another notes an urban-rural split of approximately 48% urban and rising. If your design leans too hard on online convenience, it may mirror the most connected areas rather than the full archipelago.
How to Reduce Metro Manila and Urban Luzon Bias
Start by writing quotas or targets for each major island group, then validate those targets with recruitment and response monitoring. One practical indicator of why this matters comes from category studies that report strong regional concentration. In a Philippines coffee market report, Luzon is described as the largest regional segment, accounting for approximately 62.7% of national revenue in 2025. That figure is category-specific, not a population share, but it illustrates how easily “Luzon-heavy” datasets can look plausible in analysis. For survey sampling Philippines projects, the safer approach is to stratify by island group and then manage within-region urban and provincial mixes rather than letting a panel default shape the sample.
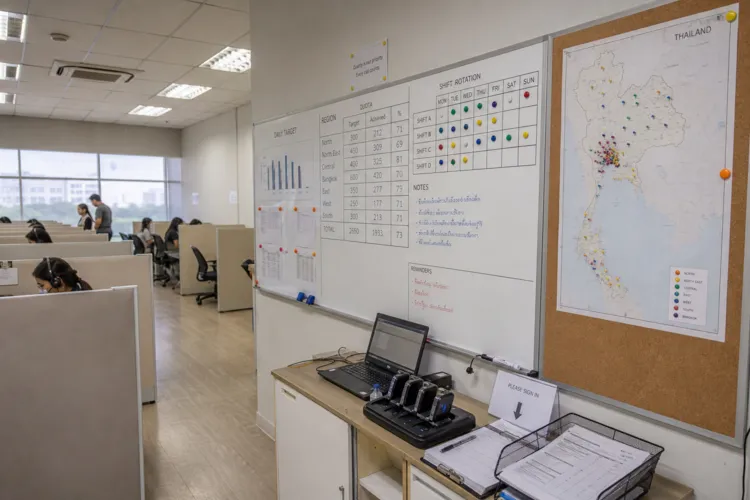
Mode choice is the second lever. Field Market Research describes survey options used in the Philippines, including online surveys (such as Google Forms and panels), telephone-based CATI, and face-to-face CAPI. It also emphasizes sampling based on location and working with agencies that have established panels. That structure supports a mixed-mode plan: use online where coverage is strong, and add CATI or CAPI where online reach is weaker or where you need better control over geography. SIS International also recommends using more than one method, because different techniques suit different research needs and help create a more comprehensive view of consumers.
Finally, strengthen recruitment and governance so the sample stays stable over time. TGM Research describes operating a proprietary double opt-in online panel in the Philippines, using a multi-source recruitment approach to minimize sample bias. It also notes continual top-up recruitment and response performance tracking, alongside adherence to the ESOMAR code of conduct. For practical execution, that means you can pair an online panel with deliberate boosts outside the usual urban clusters, then watch response rates by region and adjust. When the country’s economic activity is concentrated—Iconic Research notes Metro Manila accounts for roughly 38% of GDP—discipline in stratification and monitoring becomes the difference between “easy” data and representative insight.
What makes representative sampling difficult across the Philippine archipelago?
Why can online panels produce misleading “national” results in the Philippines?
How should survey sampling in the Philippines be structured to stay representative?
Which data-collection modes are commonly used for surveys in the Philippines?
What panel management practices can reduce sample bias over time?