Updating SES segmentation frameworks in Indonesia starts with the reality of scale and complexity. Indonesia has a population of more than 280 million, making it Southeast Asia’s largest consumer market and the world’s fourth most populous country. It accounts for roughly one-third of the region’s GDP, and domestic consumption is highlighted as a primary driver of steady economic expansion. Over the past decade, rising incomes have expanded spending power in a large, youthful middle-income segment that is described as increasingly urban, digitally engaged, and aspirational. These shifts make SES work more than an income-only exercise.
One practical update is to connect SES bands to “where growth shows up” in categories and channels. The same sources point to broad-based demand spanning FMCG, healthcare, education, financial services, and digital platforms. Digitalisation is a defining feature, supported by high smartphone penetration, affordable data, and a young, digitally fluent population that has driven rapid expansion across ecommerce, fintech, healthtech, edtech, and logistics platforms. Indonesia is also described as the largest B2C digital market in Southeast Asia, with a digital economy reaching nearly $100 billion last year. In SES design, that argues for explicit digital access and usage markers alongside classic household economics.
How to Modernize SES Segments: Mix Economy, Digital, and Culture Signals
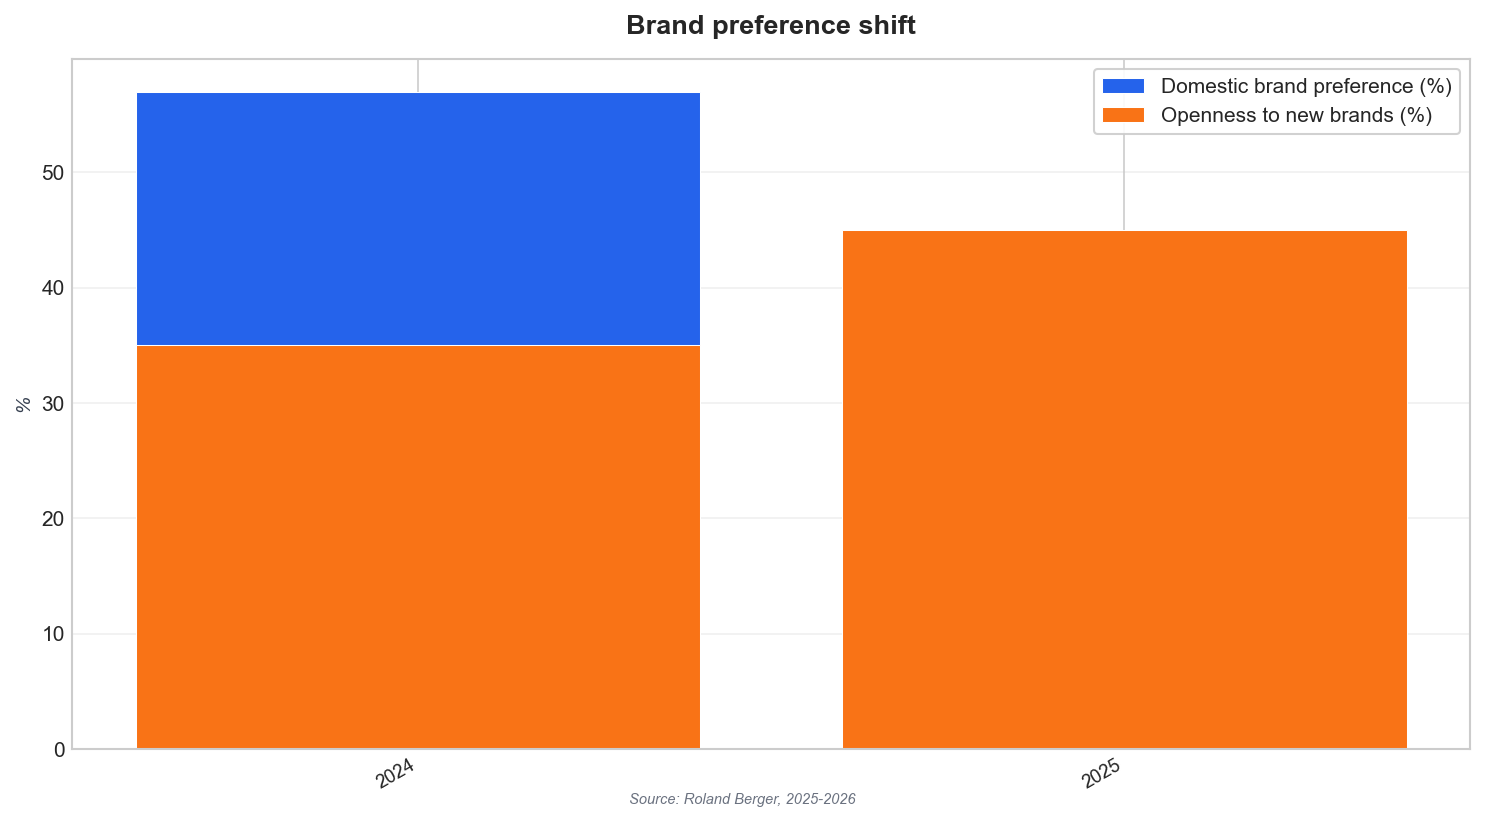
To modernize SES segmentation Indonesia teams can incorporate measurable “openness” and cultural timing into their segment definitions. Roland Berger’s Asia Consumer Study 2026 notes that about 33% of Indonesians are identified as “Tradition Keepers,” and this group helps drive major spending peaks during events like Eid and Lunar New Year. Meanwhile, preference for domestic brands dropped from 57% in 2024 to 33% in 2025, and openness to new brands rose from 35% to 45% over the same period. These shifts suggest SES segments should differentiate between “ability to spend” and “willingness to switch,” and they should include seasonal and cultural purchase cycles.
Another update is to reflect the infrastructure behind rising digital consumption. A Structure Research report forecasts the Jakarta data center colocation market at $507.2 million in 2025, rising to $856 million by 2030, expanding at a five-year CAGR of 11%. This kind of capacity buildout is not a consumer metric, but it supports the platforms and services that shape shopping, credit, and service discovery behaviors. SES frameworks that add channel-level variables, such as digital service reliance or platform usage intensity, can better describe how middle-class and aspirational households behave, not just what they earn.
Finally, SES should be refreshed with a clearer view of life stage and sentiment, not only age. Across six ASEAN countries, HILL ASEAN reports life satisfaction rates of 83.8% for Gen Z, 82.0% for Millennials, 85.2% for Gen X, and 88.8% for Baby Boomers, and it reframes these groups as “Prime Generations” who are tech-savvy and constantly updating themselves. This supports a segmentation approach that treats older cohorts as active adopters rather than late followers. When combined with Indonesia’s consumer scale and digital economy momentum, it helps marketers and analysts build SES segments that feel current, culturally grounded, and operational for targeting.
How can SES segmentation in Indonesia be updated for the emerging middle class?
What consumer shifts suggest SES models should include brand openness?
Which cultural factor should modern segmentation account for in Indonesia?
What digital-economy figures support adding digital behavior variables to SES?